What does Long Range Forecast 2018 Issued by IMD signify?
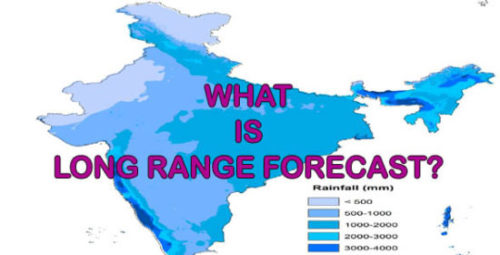
India Meteorological Department has issued first stage of Long Range Forecast (LRF) 2018 for Indian Monsoon season. LRF means how the monsoon season will be over India. Taking rainfall data for 50 years IMD has calculated that if average rainfall over India is 88.7 cm then it is supposed to understand normal rainfall over the country.
Average rainfall = Total rainfall amount recorded by number of stations in India / Total number of stations.
Read how Indian Ocean Dipole (IOD) affects Monsoon
This stage report of forecast is not enough for the farmers of the country. So in the first week of June IMD issue LRF for four different region of the country. Except Jammu and Kashmir the whole country has these four months the main source for water.
From 2004 IMD has classified the country into four sub divisions. (1) North West region (2) North East region (3) Central India (4) Peninsular India. Forecast for these regions will be issued in the first week of June.
At present IMD use statistical model for issuing LRF. Today on 16th April 2018, IMD has forecasted 97 % rainfall in monsoon season. Rainfall between 96 % to 104 % is called normal rainfall. Though percentage wise it is at the lower side but publicly it is announced as normal rainfall.
As per IMD declaration they used five parameters:
- Sea Surface Temperature (SST) Gradient between North Atlantic and North Pacific for the month December and January. Temperature gradient means increase or decrease in magnitude and is a vector quantity. Though temperature is a scalar quantity.
- Equatorial South Indian Ocean SST for the month of February.
- East Asia Mean Sea Level Pressure for the month of February and March. East Asia means Japan, Koreas, Taiwan, Hong Kong, Macau and main land of China.
- Northwest Europe Land Surface Air Temperature for the month January.
- Equatorial Pacific Warm Water Volume for the month of February and March.
Seeing other development zone wise forecast can be issued in the first week of June.
Following data to judge the prediction of IMD:
|
Year |
IMD predicted in % | Actual r/f in % | El Nino/La Nina | IOD |
|
2008 |
100 | 98 | Mod La Nina |
Neutral |
|
2009 |
96 | 77 | Mod El Nino |
Neutral |
|
2010 |
98 | 102 | Mod La Nina |
Negative |
|
2011 |
95 | 101 | Weak La Nina |
Neutral |
|
2012 |
99 | 93 | Neutral |
Positive |
|
2013 |
98 | 106 | Neutral |
Neutral |
|
2014 |
96 | 88 | Neutral |
Neutral |
|
2015 |
93 | 86 | Very strong El Nino |
Strong negative |
| 2016 | 106 | 97 | Weak La Nina |
Weak positive |
| 2017 | 96 | 95 | Decreasing |
Neutral |